

FAAMG em' or hang em?
FAAMG em' or hang em?
This week we value the FAAMG stocks, compare asset classes, and share several thoughtful posts.

Dear Clients and Friends of Farrer Wealth Advisors, we are pleased to bring you the Farrer Wealth newsletter, which includes our latest blog posts, fun facts, and general articles we find interesting. Happy reading and happy investing!
Disclaimer - This newsletter is for informational purposes only. None of the below should be considered investment advice nor solicitation for investment. Please see full disclosures at the end of this newsletter.
Latest Blog Post
FAAMG em’ or hang em?
The market has had a strong first half of the year, mainly on the back of gains made by the FAAMG stocks. As a combined basket, FAAMG is made up of Facebook (Meta), Apple, Amazon, Microsoft, and Google. These stocks have, on average, posted a 60% increase, making up almost all the gains in the S&P 500 which is up roughly 16%. On an equal-weighted basis (remember the S&P 500 is market weighted), the S&P 500 is up just 6%.
Thus, it is worth valuing this basket of stocks as they make up nearly 25% of the index. When I’m in a rush, and I don’t have the time to build discounted cashflow models to understand what’s priced into a stock price, I go back to the John Bogle rule of thumb.
John Bogle (founder of Vanguard) in his book “The Little Book of Common Sense Investing” stated that “Over time, the aggregate gains made by… shareholders must, of necessity, match the business gains of the company.” Essentially, he means that over time the gains in a stock end up equaling the gains in earnings per share + dividend yield. He proved that in this chart by taking market gains back 100 years to show that while the market can get either depressive (low earnings multiple) or exuberant (high earnings multiple) over time, these returns even out to match what companies have earned.
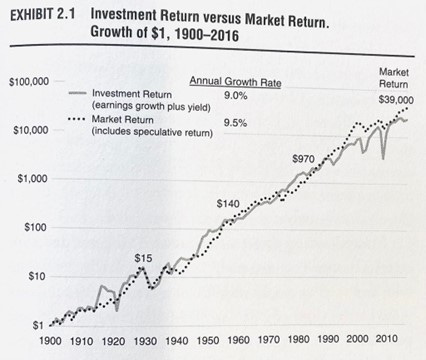
So, when I want to do a quick and dirty understanding of whether a stock is over or undervalued, I use this Bogle methodology. Now it certainly has its drawbacks – for one, how long is long-term? Is it 5 years? 10? 20? It seems from the chart misalignment happens over a five-year period, but sometimes, can even span decades. Second, does this imply an unprofitable company is worthless? It doesn’t, but it does imply that eventually profits are required to justify any sort of valuation.
So given we are halfway through the year, I thought I’d put the FAAMG to the test. A few things to note, I’ve done two analyses, one for a 10-year period and one for a 5-year period. In the 10-year period, I have not included Amazon and Meta as they were either barely profitable or completely unprofitable making the analysis a bit unusable. Second, some might point out I should use NVIDIA as well (as it’s been one of the key drivers of index gains this year) however I’ll explain later why I left this out.
The quick and dirty analysis
10 Years:

5 Years:
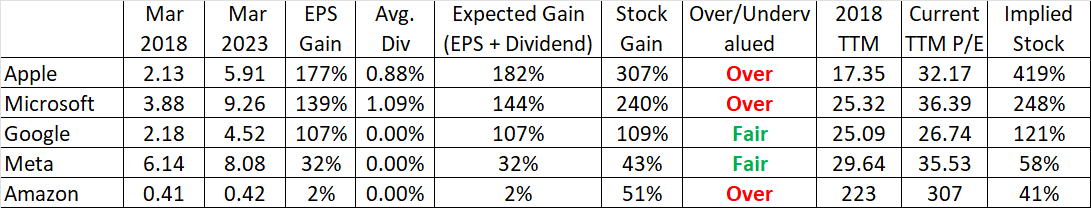
Let me explain a bit on how to read the above charts. The key columns to pay attention to are the ones marked “Expected Gain (EPS + Dividend)”, “Stock Gain”, and “Implied Stock Gain”.
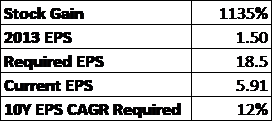
According to Bogle, overtime the gain of the stock should equal the gain in EPS + the dividend yield. So, let’s take Apple for example. 10 years ago, it had a trailing twelve-month EPS of 1.5. As of this last March, its EPS has grown to 5.91, or a gain of 294%. During that period, it paid an average dividend yield of 1.33% per year so we add that (1.33% * 10 years) to the EPS gain to get a final gain of 307%. However, the stock gain is about 1,135%. Which, according to Bogle means the stock is very overvalued. Yes, yes, I know the market is forward looking – I’ll get back to this in a second.
Coming back, if we use the Bogle definition throughout, it seems that Apple and Microsoft are overvalued no matter which of the two time-periods we use whereas Google is fairly valued. For Meta and Amazon, it appears that the House of Zuck is fairly valued well while Jassy is hoping that his EPS bounces back this next twelve months to justify the stock gain.
Ok, now back to the market being a forward looking thing. So, when a stock has increased far beyond the EPS + Dividend metric implies, it must mean the market has assigned a far higher P/E multiple to it as time has gone on (what Bogle calls the “speculative returns”). And this is precisely the case. Apple and Microsoft have seen their multiples double or triple whereas Google and Meta have stable multiples. We know this is the driving factor in the case of Apple and Microsoft as the “Implied Stock Gain” column values closely match the “Stock Gain” values. Again, take the Apple 10-year example. We can see the P/E has gone from 10x to over 30x, a gain of 3x. So if we apply that 3x multiple to the EPS gain (3*(5.91/1.50))-1+1.33%*10) you get roughly ~1,110%, which lo-and-behold matches the actual stock gain pretty darn closely. Don’t you just love it when math works out?
Ok nerd, you might ask, what does this all mean? Well, there are a few hypotheses that you can draw from this. Mostly, it seems that the market is expecting a lot from Apple and Microsoft. Let’s again use Apple (hey! It's the first in the alphabet… ok I know Google is really called Alphabet…leave me alone!) and let’s assume that we give the EPS another 10 years to replicate the stock’s current growth. So, if in 2013 the EPS was $1.50/share, we would need it to go up to around $18.5/share (or ~1135% which would equal the stock growth over the last 10 years). This required EPS growth of ~12% annually for the next 10 years just for the stock price to stay where it is.
Now some might argue that this is silly, and that an additional 10 years or any given 10 years is arbitrary, and that’s a fair argument (in fact the charts below show how any 10 years is in fact arbitrary). But the point is eventually the bill comes due. If we look at Apple’s long-term stock chart versus its EPS, it matches quite well.

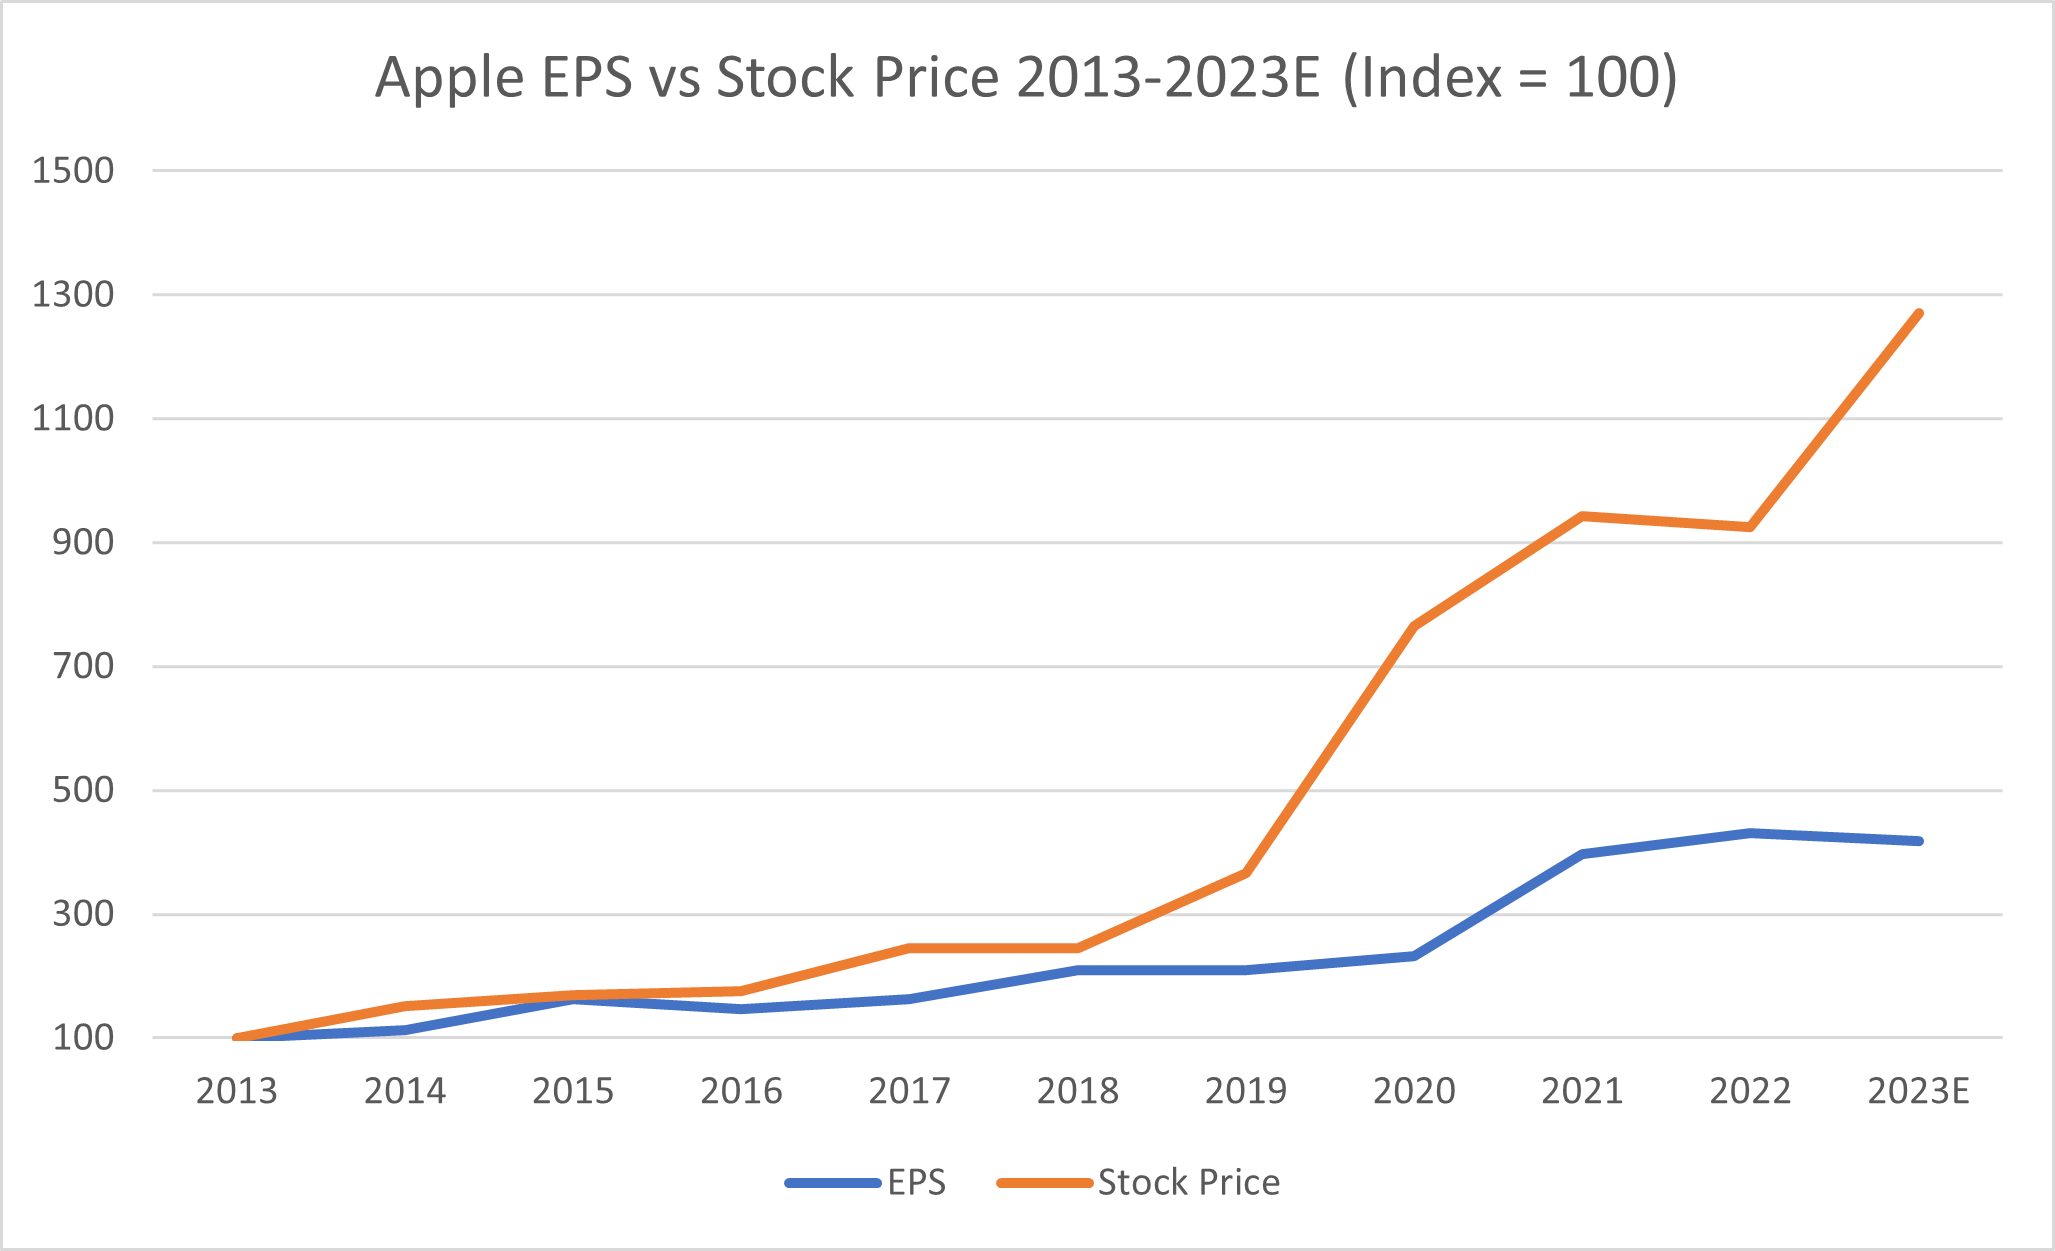
Sometimes it overshoots, and sometimes it undershoots but over-time the Bogle rule comes into effect. Now looking at these charts, one might argue that for years the stock underperformed EPS performance and it’s only now in the last 10 years that it’s starting to catch up. This is certainly the case (and thus the multiple expansion), in fact it seems for much of the 2010s Apple was actually very cheap (crazy how much the iPhone was a game changer). However, it is clear now that the rubber band is stretching the other way – and eventually it will snap. You may counter with the argument that “speculative returns” i.e the stock’s P/E multiple expanding could drive the stock price further, but in a higher interest rate environment can we really bank on increasing multiples?
In essence, what the price movements compared to EPS are telling us is that both Microsoft and Apple have “wood to chop” to grow into their valuations. This is compared to Google and Meta which have a far lower hurdle. In fact, I would predict that over the next 10 years both Google and Meta stock’s will perform quite in line with their EPS growth. Amazon is a bit of a funny case where they have a depressed EPS right now (also many would argue the stock has never traded on a P/E basis, which I guess has validity) but over the long-term I don’t think Amazon will escape the Bogle rule either.
Now coming to my earlier reason for not including Nvidia. I don’t have to do any math to know that Nvidia’s stock is currently driven by AI hype, and that the EPS vs stock growth will be highly misaligned. If AI is the saviour/game changer/world destroyer we think it is, then its quite possible that any calculation of required EPS growth could be achievable. This certainly could also be why Microsoft’s misalignment might be justified as they have been at the forefront of the AI revolution (or at least acted faster than the rest of the FAAMG companies). I think this photo well describes how AI has thrown a spanner in the mix.

I started this writeup to see if the FAAMG stocks were overvalued. It certainly seems like companies like Apple and Microsoft are, and considering their weighting in the index, it does imply that the market is getting ahead of itself. Now the drawback of this analysis, as I’ll reiterate again, is timeframes. It’s highly possible that the misalignment between stock gains and EPS gains continues for an extended period, there is no way of knowing. But investing is rarely a 100% certainty game, it’s typically a game of probabilities. Thus, in my humble opinion, the valuations for both Apple and Microsoft (and by relation the market) are probably stretched.
Thanks for reading and happy investing!
Just a quick note - if you like these posts it would be a huge help to me if you could like or share them!
Farrer Fun Fact

Ultimate Asset-Class: It seems that since the early days of modern US financial markets, one asset class is in a league of its own - Stocks. Diversification, is helpful in the short-run, but over longer periods of time, it seems like it would be a drag on returns (not investment advice). (source)
Links of the Week
This presentation (video) on “How to be a Great Analysis” is excellent and should be reviewed a few times.
For those following Singapore REITs, this post that shows rolling REIT returns was quite fascinating. The chart uses US REITs but I think its a reasonable benchmark for SG REITs.
I’ve been thoroughly enjoying a new substack lately. Its not all about finance, more about life, but this post about “Finance as Entertainment” was fun (pun intended).
A thoughtful post on Meta’s Achilles Heel.
I know I shared this before, but I was recently suggesting it to a non-finance friend, and remembered how good it is. In this video, Bill Ackman expertly explain the basics of finance and investing in under an hour. Its excellent for anyone 15 years or older who wants an intro to investing.